
In Meraki, the basic Troubleshooting tools (ping, Throughput, Traceroute, ARP Table, Routing Table) are bundled to the system. So most of the time IT Admins are capable of Troubleshooting the Devices.
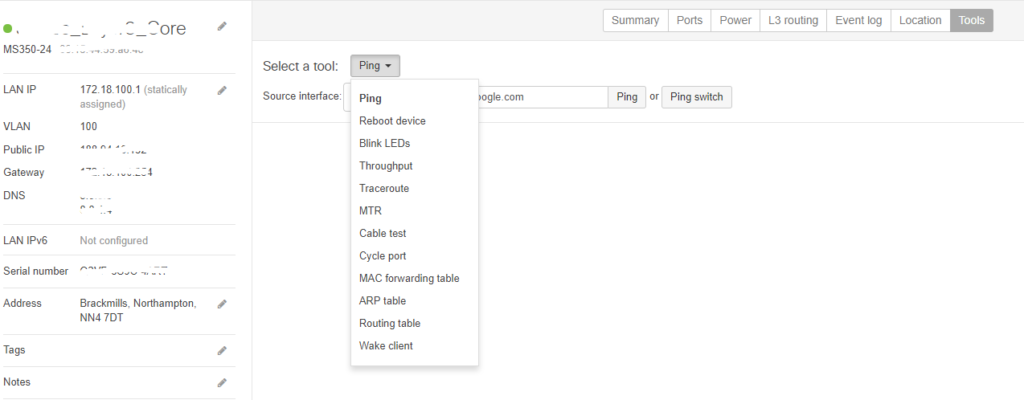
This can be accessed by selecting the Network Device listed under the Site (Device –> Tools).
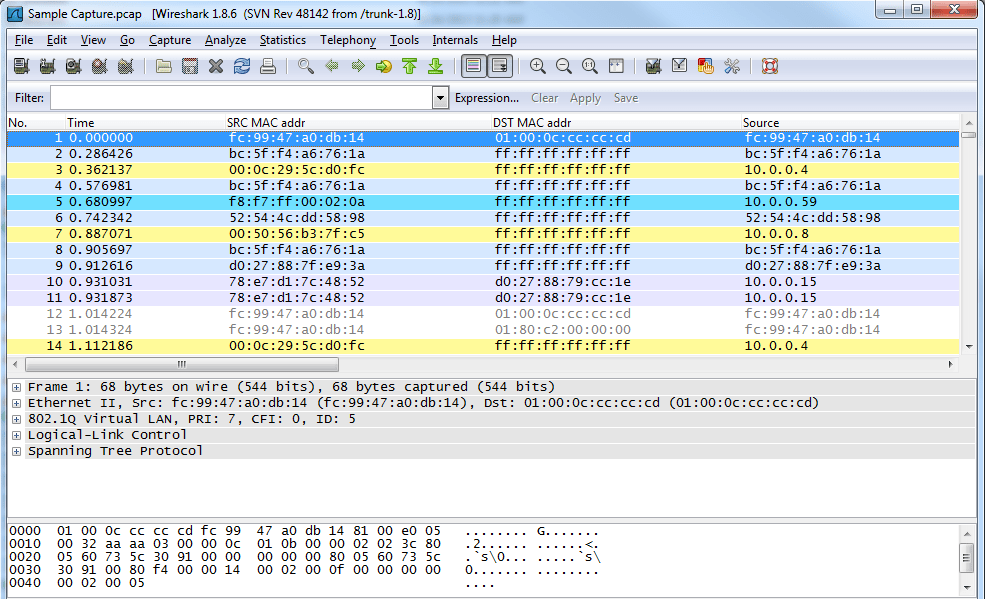
But there are times, where IT Admins need through data analysis. This can not be achieved with the inbuilt tools. So this will require a .pcap file. This file can be generated on the Network Interface and then can be downloaded to the engineer’s computer.
As we all know, software like Wireshark (formerly known as Ethereal) should be installed on the Engineer’s computer.
This is not possible under the described section of tools.
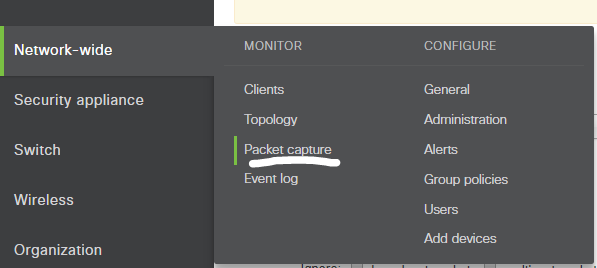
So, to make this configured you will need to access the Network-Wide Tab and then Select Packet Capture.
After selecting the Tab, you will find the option to choose the applicable Network Device.
By default, it will show “for security appliances”
Apart from the above, you will find “for access points” & “for switches”
In my example, the requirement is to get the Layer 3 device packet capture (so i will be choosing the “for switches“).
Also, I need to get the statistics for the port “22” (these utilized port information can be retrieved through the Network Device summary information)
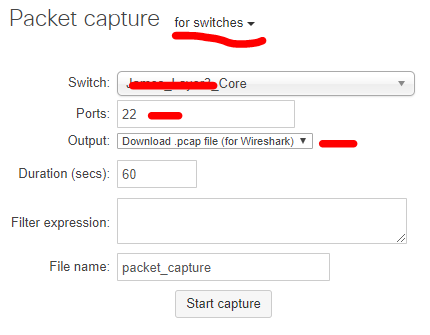
I have selected the specified Switch and Port as 22, the main change to be done is under “Output”
I have selected “Download .pcap file (for Wireshark)”
Then, you are ready to go.
Simply, click “Start Capture” and it will generate the Packet-Trace in .pcap format.
NOTE: If you do not have the Wireshark installed, you can simply get the output in the Window itself. For that, you can simply select “view output below” instead “Download .pcap file (for Wireshark)“.