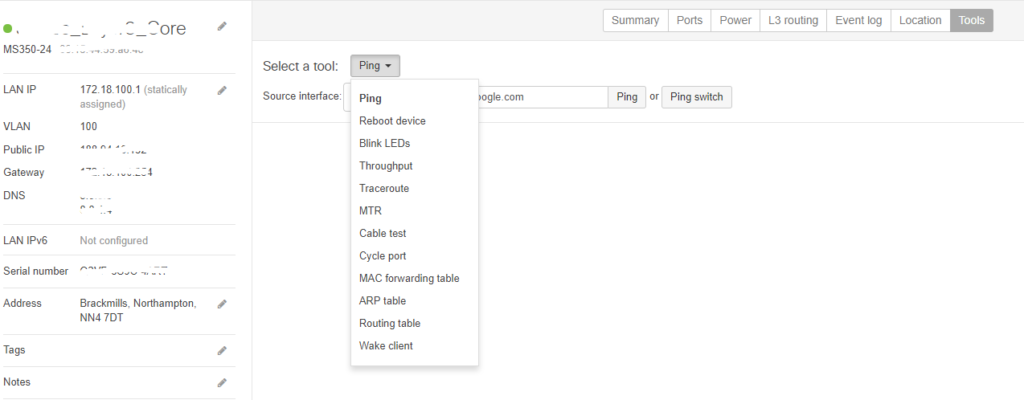
In Meraki, the basic Troubleshooting tools (ping, Throughput, Traceroute, ARP Table, Routing Table) are bundled to the system. So most of the time IT Admins are capable of Troubleshooting the Devices.
This can be accessed by selecting the Network Device listed under the Site (Device –> Tools).
But there are times, where IT Admins need through data analysis. This can not be achieved with the inbuilt tools. So this will require a .pcap file. This file can be generated on the Network Interface and then can be downloaded to the engineer’s computer.
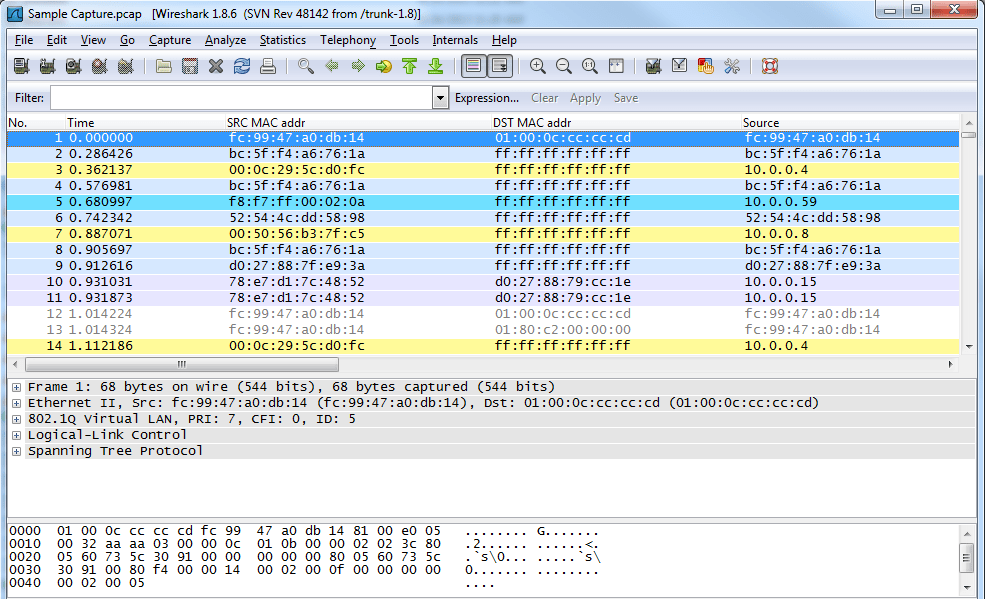
As we all know, software like Wireshark (formerly known as Ethereal) should be installed on the Engineer’s computer.
This is not possible under the described section of tools.
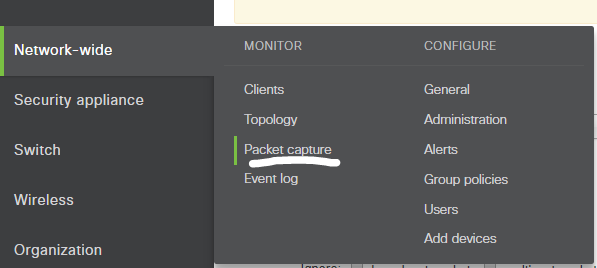
So, to make this configured you will need to access the Network-Wide Tab and then Select Packet Capture.
After selecting the Tab, you will find the option to choose the applicable Network Device.
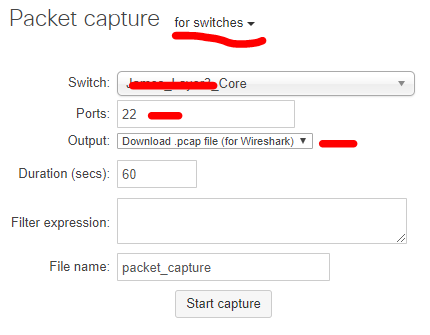
By default, it will show “for security appliances”
Apart from the above, you will find “for access points” & “for switches”
In my example, the requirement is to get the Layer 3 device packet capture (so i will be choosing the “for switches“).
Also, I need to get the statistics for the port “22” (these utilized port information can be retrieved through the Network Device summary information)
I have selected the specified Switch and Port as 22, the main change to be done is under “Output”
I have selected “Download .pcap file (for Wireshark)”
Then, you are ready to go.
Simply, click “Start Capture” and it will generate the Packet-Trace in .pcap format.
NOTE: If you do not have the Wireshark installed, you can simply get the output in the Window itself. For that, you can simply select “view output below” instead “Download .pcap file (for Wireshark)“.
We use cookies on our website to give you the most relevant experience by remembering your preferences and repeat visits. By clicking “Accept”, you consent to the use of ALL the cookies.
This website uses cookies to improve your experience while you navigate through the website. Out of these, the cookies that are categorized as necessary are stored on your browser as they are essential for the working of basic functionalities of the website. We also use third-party cookies that help us analyze and understand how you use this website. These cookies will be stored in your browser only with your consent. You also have the option to opt-out of these cookies. But opting out of some of these cookies may affect your browsing experience.
Necessary cookies are absolutely essential for the website to function properly. These cookies ensure basic functionalities and security features of the website, anonymously.
Cookie
Duration
Description
cookielawinfo-checbox-analytics
11 months
This cookie is set by GDPR Cookie Consent plugin. The cookie is used to store the user consent for the cookies in the category "Analytics".
cookielawinfo-checbox-functional
11 months
The cookie is set by GDPR cookie consent to record the user consent for the cookies in the category "Functional".
cookielawinfo-checbox-others
11 months
This cookie is set by GDPR Cookie Consent plugin. The cookie is used to store the user consent for the cookies in the category "Other.
cookielawinfo-checkbox-necessary
11 months
This cookie is set by GDPR Cookie Consent plugin. The cookies is used to store the user consent for the cookies in the category "Necessary".
cookielawinfo-checkbox-performance
11 months
This cookie is set by GDPR Cookie Consent plugin. The cookie is used to store the user consent for the cookies in the category "Performance".
viewed_cookie_policy
11 months
The cookie is set by the GDPR Cookie Consent plugin and is used to store whether or not user has consented to the use of cookies. It does not store any personal data.
__cfduid
1 month
The cookie is used by cdn services like CloudFare to identify individual clients behind a shared IP address and apply security settings on a per-client basis. It does not correspond to any user ID in the web application and does not store any personally identifiable information.
Functional cookies help to perform certain functionalities like sharing the content of the website on social media platforms, collect feedbacks, and other third-party features.
Cookie
Duration
Description
__cf_bm
30 minutes
This cookie is set by CloudFare. The cookie is used to support Cloudfare Bot Management.
Performance cookies are used to understand and analyze the key performance indexes of the website which helps in delivering a better user experience for the visitors.
Cookie
Duration
Description
YSC
session
This cookies is set by Youtube and is used to track the views of embedded videos.
Analytical cookies are used to understand how visitors interact with the website. These cookies help provide information on metrics the number of visitors, bounce rate, traffic source, etc.
Advertisement cookies are used to provide visitors with relevant ads and marketing campaigns. These cookies track visitors across websites and collect information to provide customized ads.
Cookie
Duration
Description
IDE
1 year 24 days
Used by Google DoubleClick and stores information about how the user uses the website and any other advertisement before visiting the website. This is used to present users with ads that are relevant to them according to the user profile.
test_cookie
15 minutes
This cookie is set by doubleclick.net. The purpose of the cookie is to determine if the user's browser supports cookies.
VISITOR_INFO1_LIVE
5 months 27 days
This cookie is set by Youtube. Used to track the information of the embedded YouTube videos on a website.