
We all are aware of Windows BSOD (Blue Screen Of Death), what about PSOD (Purple Screen Of Death).
PSOD is a fatal crash of VMware ESX/ESXi hosts which kills all active Virtual Machines. A diagnostic screen with white type on a purple background.
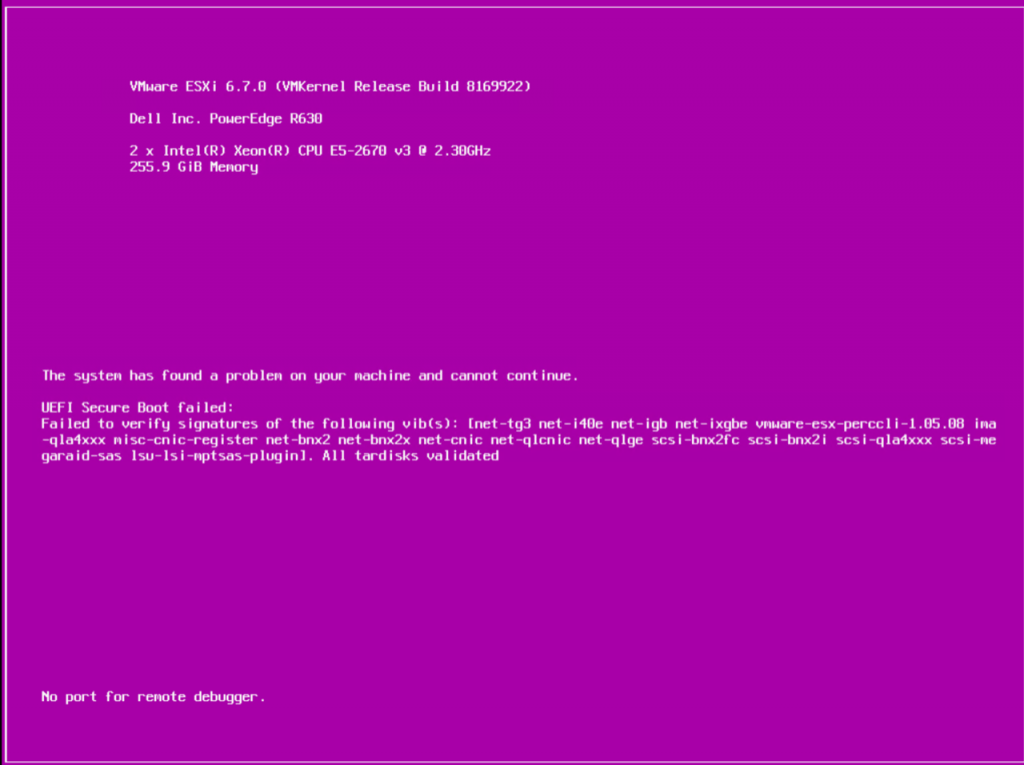
This PSOD is also generating a DUMP file, so that the Administrators can drill down the Issue and carry out a proper RCA.
Before jumping into the DUMP file analysis, it is always recommended to analyze the ESXi log files;
If the issue ie related to the Host system, you can analyze the below files;
- VMkernel summary – /var/log/vmksummary.log
- ESXi host agent log – /var/log/hostd.log
With the help of those above log files, we can easiliy identify whether a DUMP file has been generated or not
If a DUMP file has been generated, below is the set of steps to be carried out;
Step 01:
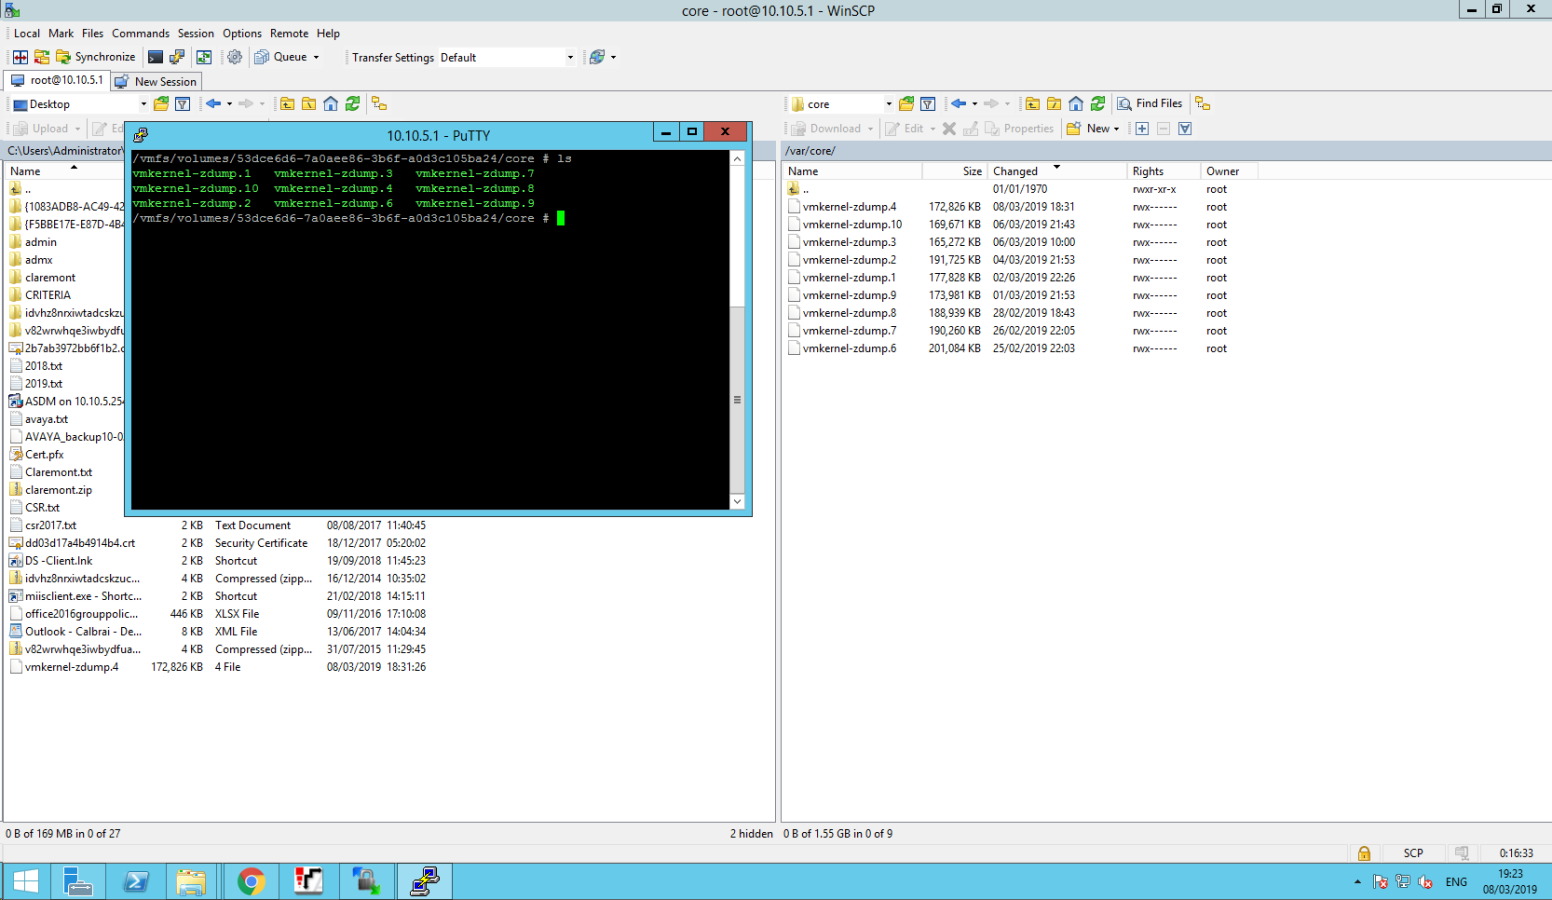
Once the host is up and running, login to the host through SSH (with Putty).
Then go to the core directory. The core directory is the location where your PSOD is stored at (cd var/core).
You can list down the PSODs with the ls command (in my case, there are 9 DUMP files).
Step 02:
Upon the confirmation, you can start downloading the DUMP files to your workstation.
Here, i have used WinSCP
browse /var/core path and copy the latest DUMP file (vmkernel-zdump.4).
Step 03:
Once you are done with downloading the DUMP file, open the file using WordPad or Notepad++
Then search for the keyword starting from @BlueScreen (Tells the crash exception followed by @BlueScreen)
Step 04:
Take a note of the error and search it on the VMware Knowledge Base
Then you can apply the Patches/Updates as advised by the VMware.